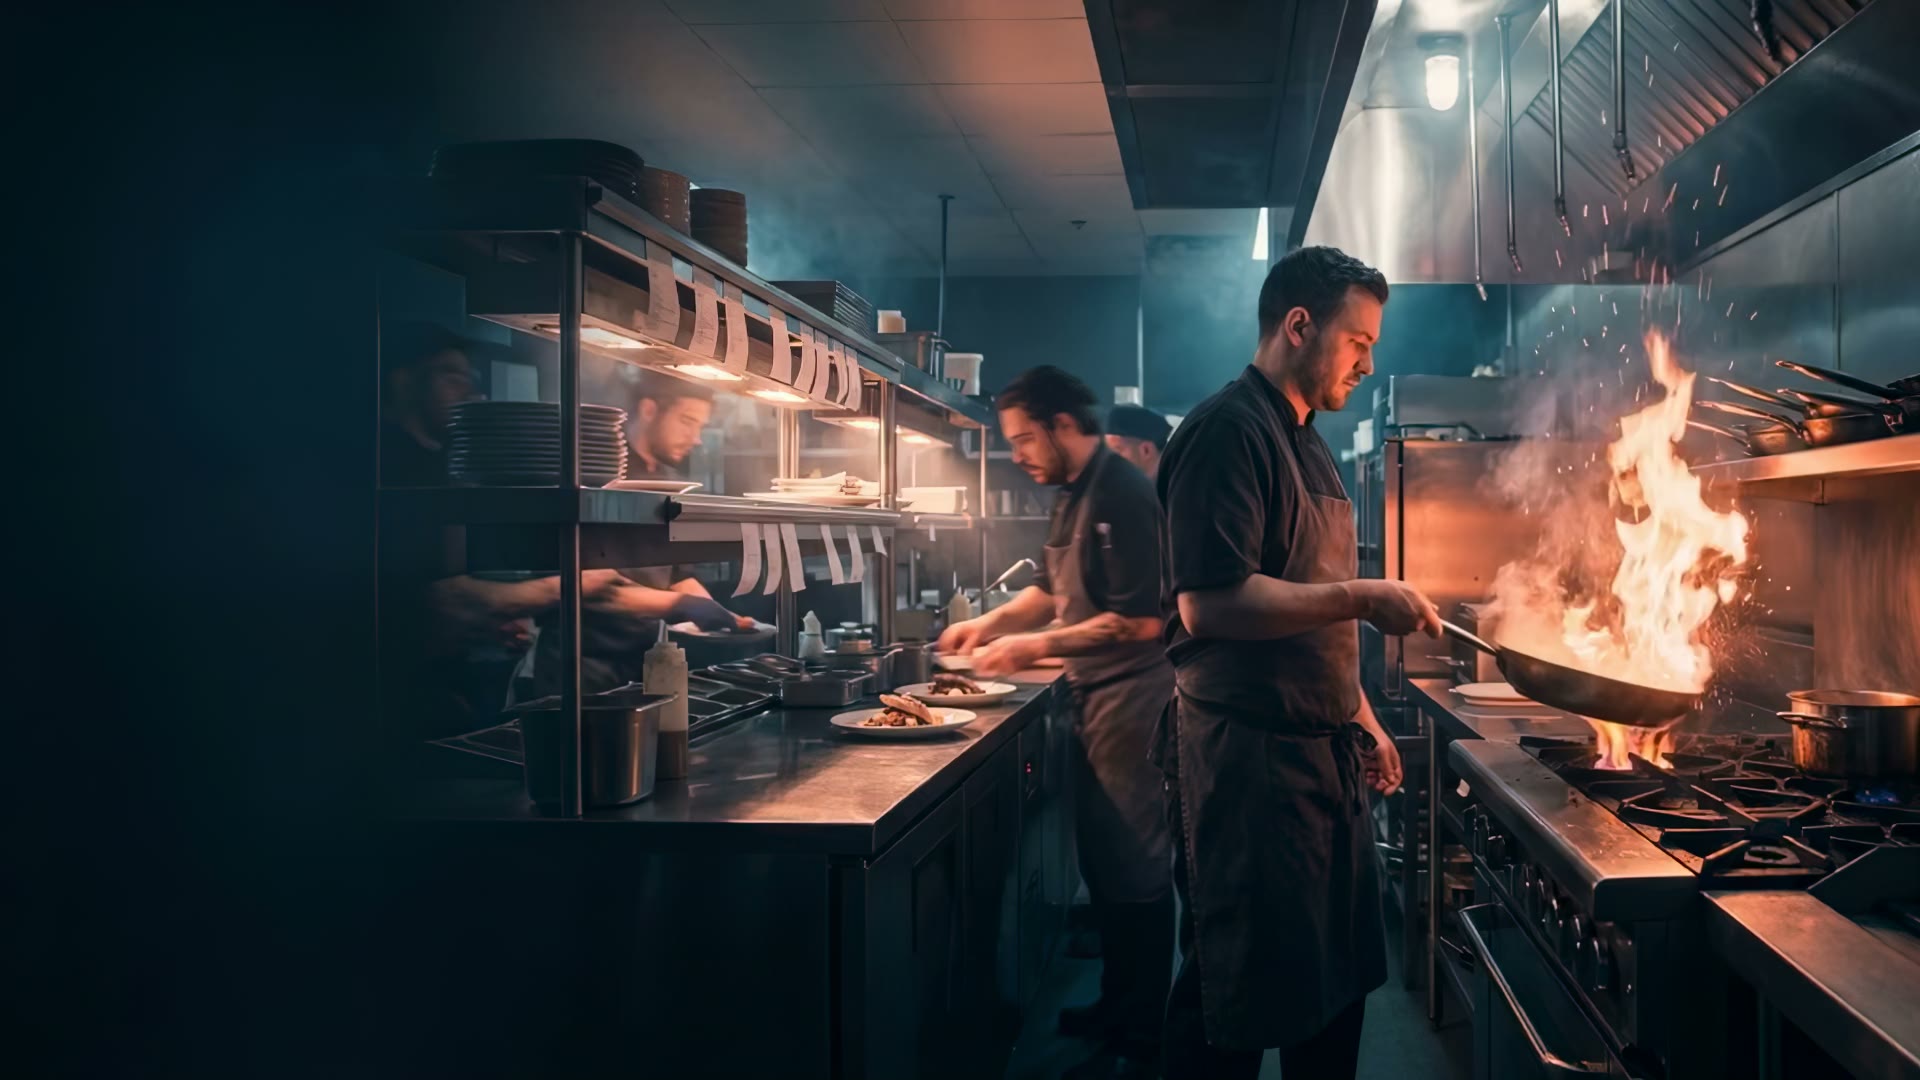

TL;DR: The average independent restaurant wastes between 4% and 10% of every dollar of food it buys — and 58% of that waste happens before a single customer orders. It's not the half-eaten plates coming back to the dish pit. It's the trim, the pre-portioned mise-en-place that didn't sell, the sheet pans you prepped on a hunch, and the protein you defrosted because Saturday "felt busy." Cutting prep waste by 40% adds $20,000 to $40,000 a year to the bottom line of a typical independent shop. Most operators have never measured it.
The waste you can see is the smaller half
Walk into a hundred independent restaurant kitchens and ask the chef where the food waste is. Ninety-five of them will point at the dish pit. Plate scrapings. Customer leftovers. The salad that came back because somebody forgot to say "no onions."
That's a real bucket of waste. It's also the smaller bucket.
Pre-consumer food waste — prep, over-production, and spoilage — accounts for 58% of all restaurant food waste. Plate waste is the other 42%. Which means the food you and your team threw out before service even started outweighs everything your customers left behind.
That's not a marketing problem. That's not a portion-size problem. That's an operations measurement problem, and it's the one nobody talks about because nobody's looking.
What "4 to 10 percent" actually means in your bank account
The blunt industry number: restaurants and food service providers waste an average of 4–10% of the food they purchase.
Let's translate that.
A typical full-service independent runs 30% food cost. On $1,000,000 in revenue, you're spending $300,000 a year on food. Apply the industry waste range:
- At 4% waste: $12,000 walks out in the trash
- At 7% waste (the median): $21,000 walks out in the trash
- At 10% waste: $30,000 walks out in the trash
The National Restaurant Association estimates the industry-wide cost of restaurant food waste at $162 billion every year, with up to a 4% direct hit on profit margins.
That's not a footnote. On a 6% net margin shop, a 4-point hit on profit is two-thirds of your take-home.
And the kicker: a 40% reduction in waste puts $20,000 to $40,000 back on the bottom line of a typical independent restaurant annually. That's a hire. That's a new oven. That's the cushion that gets you through a slow February.
Where the 58% actually lives
Pre-consumer waste is not one thing. It's six things, and most kitchens have all six.
1. Trim and yield loss. A whole salmon yields ~50% finished filet by weight. A case of romaine yields ~70% usable leaf. If your recipe costing assumes 100% yield, you're already underwater on day one — and your variance shows up as "waste" because the math says it should still be in the walk-in.
2. Prep over-production. Every kitchen has the same routine: somebody eyeballs the prep list before service, doubles the riskiest items "just in case," and the unused half goes in the lowboy. By Wednesday you're throwing out Sunday's prep because nothing on the line that's been there four days survives a health inspector or a chef's nose.
3. Mise-en-place spoilage. Cut tomatoes are good for 24 hours. Cut romaine, 36. Aioli, two days in a sanitized container. Operators who prep on a five-day rhythm in a four-day-shelf-life kitchen are paying for the same labor twice — once to make it, once to scrape it into the bin.
4. Defrost-without-demand. "We pulled three cases of chicken thighs because last Saturday was big." This Saturday wasn't. Now you have 80 pounds of partially-thawed protein that needs to move in 48 hours, so it goes on the special, gets discounted, drags down food cost, and the rest hits the dumpster on Monday.
5. Recipe drift. The line cook who's been there four years pours olive oil "by feel" because the squeeze bottle is the same one he's used since 2024. He's putting 40% more on every plate than the spec calls for. Multiply by 200 covers a night.
6. Unmeasured shrink. Dropped, burnt, sent back, eaten by staff, stolen. None of it shows in the POS. All of it shows in your monthly P&L as "food cost was higher than it should have been" — and nobody can explain why.
These six leaks are not character flaws. They're the predictable output of a kitchen that prepares food without a forecast and counts inventory without a variance loop. The chains solved this thirty years ago. Independents are still operating on instinct.
Why your gut feel can't fix this
Here's the trap. Every independent operator I talk to has a story about the time they "caught" a waste problem and fixed it. Usually the story ends with "we yelled at the line about portioning and it got better for a month."
It got better for a month because attention is a real intervention. It got worse the next month because attention isn't a system.
The chain restaurants don't yell at the line. They watch a screen that compares what should have been used (theoretical food cost, derived from item-level recipes × items sold) with what was actually used (actual food cost, derived from inventory in minus inventory out). The gap between those two numbers is your variance — and that variance, in dollars, is the waste you can't see by looking at the dish pit.
A typical chain runs that variance under 1.5% of food sales. A typical independent runs it at 4-8%. That gap — call it the measurement gap — is exactly the $20,000 to $40,000 the research says you can claw back.
The four-loop fix
You don't need a chef-as-data-scientist to close that gap. You need four loops working together:
Loop 1 — Forecast. Pull last 8 weeks of sales by item, by daypart, by day of week. Adjust for weather and known events. The output is an item-level demand forecast for tomorrow. Every chain does this. Most independents don't, because the data lives in three different systems that don't talk to each other.
Loop 2 — Prep target. Multiply the forecast by your par recipes. The output is "make 18 pans of chicken Marsala mise, not 24." This is the single biggest lever on pre-consumer waste, because you stop over-prepping on Tuesday for a Saturday rush that may not come.
Loop 3 — Variance log. Weekly, compare theoretical food cost (from forecast × recipes × items sold) to actual (from inventory counts). If the gap is more than 2 points, you have a leak. If it's the same item every week, you have a recipe drift or a portion problem you can name and fix in a single line meeting.
Loop 4 — Menu engineering. Items that score "low velocity, high prep complexity" are waste factories. The kale-and-quinoa salad that sells four times a week and requires six prepped components is costing you more in spoiled mise than it earns in revenue. Cut it, simplify it, or batch-make it. Re-engineer quarterly.
Run those four loops for one quarter and your variance number drops. Not because anyone's working harder — because the prep list finally matches what customers actually ordered.
What this looks like inside KitchenRush
Every independent operator on KitchenRush gets the four loops as one piece of software, not four:
- Forecasting runs nightly off the POS feed (no manual export, no spreadsheet)
- Prep targets print in the kitchen the morning of service, item by item
- Variance logs populate weekly in the Analytics tab, with the dollar value of the leak called out by item
- Menu engineering flags every quarter which items are silently bleeding the kitchen
Owner.com sells parts of this for one tier of pricing. Toast sells parts of it for another. Restaurant365 sells the spreadsheet version of it for $400 a month if you can get someone to learn it. KitchenRush bundles all four loops at the same flat $399.99 a month that runs the rest of the platform — because if you can't measure waste, none of the other modules pay for themselves.
The harder truth
I spent ten years at Domino's. The thing that surprised me when I went home to help run my family's pizza shop wasn't that the chain had better food (it doesn't). It wasn't that the chain had a better location (it usually doesn't). It was this:
The chain knew, hour by hour, what its variance was. We didn't know what ours was, ever.
That's the entire game. The chain isn't out-cooking you. The chain is out-measuring you. And measurement at hourly resolution is exactly the unfair advantage that's been locked behind enterprise software for thirty years.
It doesn't have to be locked anymore.
If you're staring at a 7% variance number and the realization is hitting that you've been giving away $25,000 a year for five years running — that's a $125,000 number, and it's recoverable. Not all of it. Not in one quarter. But most of it, in two.
The first move is just measuring it. The rest is mechanical.
Ready to see what your variance actually is? Run a free Pulse Check at kitchenrush.app and we'll show you the leaks your P&L is hiding.